2012 Top 100 Giants: Design Fees by Project Type
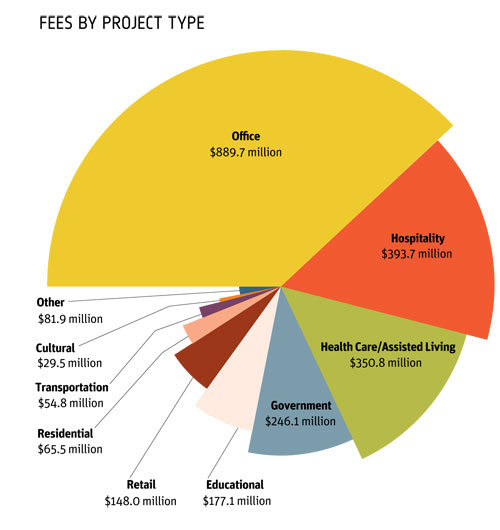
The data below comes from the first installment of the two-part annual business survey of Interior Design Giants, comprising the 100 largest firms ranked by interior design fees for the year ending December 31, 2011. The fees cover all markets, design practices from strategic planning to project management, and those acquired for work performed by employees and independent full-time contractors.
|
2012 Top 100 Giants: Design Fees by Project Types |
||
|
Projects |
2011 Fees |
% |
| Healthcare/Assisted Living | $350.8 million | 14% |
| Corporate Offices | $889.7 million | 37% |
| Hospitality | $393.7 million | 16% |
| Government | $246.1 million | 10% |
| Educational | $177.1 million | 7% |
| Retail | $148.0 million | 6% |
| Residential | $65.5 million | 3% |
| Transportation | $54.8 million | 2% |
| Cultural | $29.5 million | 1% |
| Other | $81.9 million | 3% |
|
Total: |
$2.437 billion | 100% |

*Fees generated from healthcare projects represented 14% of all design fees earned in 2011
| Healthcare Design Fees Trends | |
| 2012 Giants (2012 forecast) | $381 million |
| 2012 Giants (2011 actual) | $351 million |
| 2011 Giants (2010 actual) | $331 million |
| 2010 Giants (2009 actual) | $360 million |
| 2009 Giants (2008 actual) | $386 million |
| 2008 Giants (2007 actual) | $318 million |
Continue on to read:
2012 Top 100 Giants: Who Ranks Highest in Each Market?
Top 100 Giants: Healthcare


