2014 Top 100 Giants: Firms & Fees
72 firms report increased earnings—only 21 could say the same for 2009. Corporate offices remain the biggest generator, at 36 percent of fees, and hospitality, number two, rose slightly, to 18 percent. Coming in third, at 14 percent, health care/assisted living actually fell a bit. Residential and retail both saw significant gains for a combined 10 percent. For 2014, the Giants predict that the hot zones will be education, retail, and hospitality.
See the infographic for design fees in each market segment (office, hospitality, etc)
.
In 2013, the Giants employed roughly 13,500 designers, up 13 percent from 2012 and up a whopping 55 since 2009. Designers make up a higher percentage of the work force, too, at 51—a big jump after hovering at about 45 percent. Even better news: Giants want to add 1,300 designers in 2014.

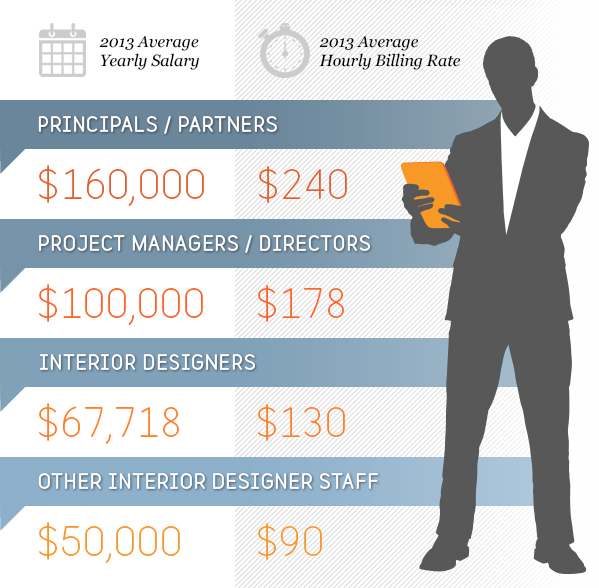
Average fees generated per employee at the “designer” level remained steady at about $221,000. Meanwhile, the hourly billing rate for a designer has risen slowly to come in at $130, up from $115 two years prior. In the same period, hourly billing rose from $157 to $178 for managers and from $200 to $240 for partners. Yet designer salaries dropped 3 percent, to $67,000, while manager and partner salaries held at $100,000 and $160,000, respectively.
Increasing head count is a major issue, according to 78 percent—only 70 said the same last time. Responses to other staffing queries are trending in the same direction. Retaining staff is a concern for 36 percent, up from 29, and 39 percent say staff training is crucial, up from 33. When business is robust, it’s only natural that firms worry more about getting the work done than they do about getting the work. The percentage of firms anxious about finding new clients went down from 52 to 44. In fact, nearly three out of four firms gave “earning appropriate fees” greater importance than “fear about the economy.”
|
|
|
|
|
|
|
|
|
|
|
|
|
|
|
|
|
|
|
|
|
|
|
|
|
|
|
|
|
|
|
|
|
|
|
|
|
|
|
|
|
|
|
|
|
|
|
|
|
|
|
|
|
|
|
|
|
<< Back to main article
2014 Top 100 Giants: Rankings
2014 Top 100 Giants: Growth


