

Healthcare Giants 2022
We gather here today to look back at the stabilizing effects 2021 had on the Interior Design Healthcare Giants. But in doing so we find we just can’t quit 2020. In our tracking of business trend data for the group of top 40 firms doing significant work in the healthcare arena since 2019, we have seen huge fluctuations driven by the pandemic. But within those ups and downs, we are just now beginning to see what normal business for the sector might look like.
Rankings 2022
| wdt_ID | 2022 Rank | Firm | HQ Location | Design Fees (in millions) | Value (in millions) | Sq. Ft. (in millions) | 2021 Rank |
|---|---|---|---|---|---|---|---|
| 1 | 1 | HDR | Omaha | 60.90 | 181 | 0 | 3 |
| 2 | 2 | CannonDesign | New York City | 60.00 | 0 | 0 | 4 |
| 3 | 3 | Perkins&Will | Chicago | 56.40 | 2 | 0 | 2 |
| 4 | 4 | Gensler | San Francisco | 50.90 | 0 | 0 | 12 |
| 5 | 5 | Perkins Eastman | New York | 41.60 | 842 | 0 | 9 |
| 6 | 6 | AECOM | Dallas | 40.50 | 789 | 0 | 6 |
| 7 | 7 | HKS | Dallas | 40.20 | 27 | 12 | 7 |
| 8 | 8 | SmithGroup | Detroit | 34.20 | 0 | 0 | 11 |
| 9 | 9 | HOK | New York | 33.30 | 33 | 29 | 1 |
| 10 | 10 | HGA | Minneapolis | 28.10 | 0 | 0 | 15 |
Total fees for 2021 came in at $651 million. On first blush, this 18-percent drop from 2020’s $790 million seems troubling. But 2021 is still significantly up from 2019’s $607 million. That pre-pandemic total might be our baseline glimpse of what this group’s total business is, or should, look like—or at least hint at the dollar neighborhood where they work.
Firms clocked 128 million total square feet in 2021, down 18 percent from 155 million, but again with the crazy 2020 numbers. About 47 percent each of all that work was split between new projects and renovations, and about 5 percent being refreshes.
Some things that haven’t changed much are the healthcare business segments. Acute-care hospitals remain the dominant work environment, accounting for $314 million, nearly half (46 percent) of total fees. Acute-care hospitals made up only 38 percent of work in 2019, but this rate jumped in 2020, to 46 percent, and has held steady.
The next two largest segment are facilities for senior living ($92 million) and rehab ($71 million), making up 14 and 10 percent of total fees, respectively. Doctor/dental offices, urgent-care/walk-in clinics, and facilities for mental health, outpatient, skilled nursing, and telehealth all came in single digits percentage-wise. But, lest we disregard the nickels and dimes, all these smaller segments combined made up 30 percent of overall fees.
Interior furniture and fixtures (F&F) and construction products were down 35 percent to $12 billion. Were the previous 2020 heights of $18.3 billion just Icarus testing new wings? Perhaps. The 2022 forecast is about even. Firms expect to see growth in hospital and senior-living work in 2022, as well as clinic, outpatient, and mental-health facilities. Though the total expected drop-off is about 24 percent, no appreciable drop-off is expected in any one segment. (More on these forecasts in a moment.)
Most of our Giants in all their varied groups—Top 100, Rising, Hospitality—do their work within the U.S., and the Healthcare Giants are no different. Jobs outside the U.S. have trended downward with only 10 percent doing this work in 2019 and 8 percent in 2021. Asia/Pacific Rim is by far the chosen destination outside the U.S., with significant work also being done in Canada and Europe. That said, it would be no surprise to see even fewer firms doing international work, as not many see any real growth there (though 20 percent think Europe could heat up). Most of the growth is in the southern U.S.—as in the entire South from coast to coast.

Submit Now for Interior Design‘s Giants of Design
Apply to be recognized in Interior Design’s prestigious Giants of Design rankings.
Fees by Project Type
| wdt_ID | Healthcare Segment | Actual 2021 | Forecast 2022 |
|---|---|---|---|
| 1 | Acute Care Hospital | 46 | 44 |
| 2 | Assisted Living | 2 | 2 |
| 3 | Senior Living | 4 | 5 |
| 4 | Rehabilitation Facility | 5 | 5 |
| 5 | Outpatient Procedure/Surgery Center | 14 | 13 |
| 6 | Mental Health Facility | 6 | 6 |
| 7 | Health Clinics: Urgent Care, Walk-in Clinics, Community Health Centers | 10 | 9 |
| 8 | Doctor/Dental Office | 3 | 4 |
| 9 | Health & Wellness/Fitness Center | 3 | 4 |
| 10 | Skilled Nursing Facility/Hospice | 2 | 2 |
Now, we suggested there may be things brewing outside the data we collected. The Healthcare Giants we spoke with at a recent roundtable discussion hosted by Interior Design claim that the market gates opened back up in the first half of ’22 and firms are swamped, sporting 12-month backlogs and challenges finding enough talent to handle it. It’s anecdotal but could be possibly significant.
Another possibility: underestimated growth in mental-health facility projects. Firms have been receiving requests for emergency department design (with some hospitals building entirely new wings to accommodate demand) that include mental-health spaces—and some Healthcare Giants report that facilities need to expand because they cannot handle the influx of patients right now. Plus, the need for these spaces isn’t limited to patients; some centers are designing them for medical professionals to decompress, reboot, and potentially avoid burnout. Then there’s the new layer of COVID-mindful design—and flexibility—overall. Can a space function as a patient room, a place for ER overflow, and an ICU room for extreme cases? Facilities need to be able to function in different ways depending on caseload.
This also applies to finishing touches within that room: Surfaces must be infection-resistant, which means no more woven fabrics and less carpeting than ever before. Ventilation and designing the exterior of facilities for traffic flow to accommodate potential drive-through testing/vaccination/treatment are also new considerations.
These points are why 2022 may give a better glimpse of what a normal, healthy year looks like. The Healthcare Giants forecast $570 million in total fees, 3,300 projects, and 150 million square feet of work. Given what the 2019 and 2021 numbers are—sandwiching the worst of a bad stretch for society that required billions in new medical resources to navigate—those predictions don’t look so bad. And the word on the street, at least right now, suggests business is already on a much-welcomed upswing.
most admired firms in healthcare giants

Projects
Perkins&Will Puts Environmental Initiatives at the Fore for This Office in Houston
2021 Best of Year winner for Large Corporate Office. Perkins&Will consolidates the headquarters of the Waste Management office in Houston.
Projects
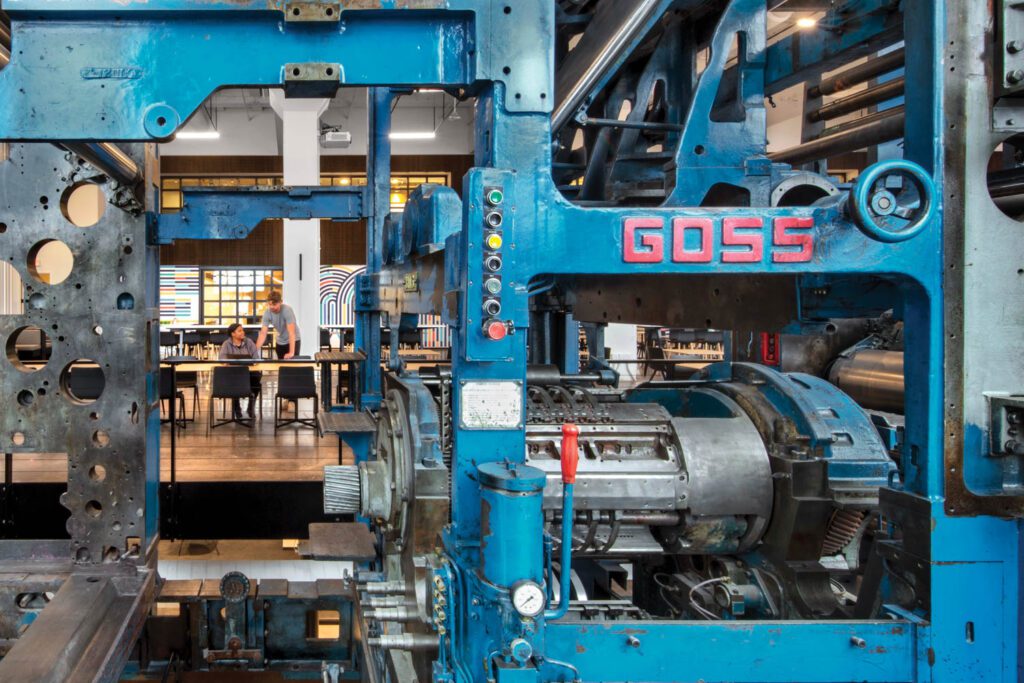
CannonDesign Transforms the Interiors of a Former Newspaper Building into Modern Tech Offices
Vintage printing machinery, housed in a former newspaper building, enlivens new offices for Square and Cash App in St. Louis.

Projects
NBBJ Envisions a Sustainable Office With a 12-Story Ribbon Park in Korea
2021 Best of Year winner for On the Boards – Commercial. When completed in 2024, the fintech company’s 1 million-square-foot headquarters will focus on the restorative: The idea that people can actually leave the offic…
“Incorporating health and wellness is increasingly important to today’s clients in demonstrating they’re making sure that their employees feel safe.”
—Janet Morra, Marguiles Peruzzi
Global Growth Potential (Next 2 Years)
United States
| wdt_ID | Region | Percentage |
|---|---|---|
| 1 | Total - US | 98 |
| 2 | Northeast (CT, MA, ME, NH, NJ, NY, PA, RI, VT) | 48 |
| 3 | Midsouth (TX, OK, AR, LA, MS) | 59 |
| 4 | Southeast (AL, TN, KY, NC, SC, GA, FL) | 70 |
| 5 | Mid-Atlantic (DC, DE, MD, VA, WV) | 55 |
| 6 | Midwest (IN, IA, IL, KS, MI, MN, MO, ND, NE, OH, SD, WI) | 43 |
| 7 | Northwest (AK, ID, MT, WA, OR, WY) | 34 |
| 8 | Southwest (AZ, CA, CO, HI, NM, NV, UT) | 61 |
International
| wdt_ID | Region | Percentage |
|---|---|---|
| 1 | Total - International | 39 |
| 2 | Canada | 11 |
| 3 | Mexico | 5 |
| 4 | Central/South America | 7 |
| 5 | Caribbean | 2 |
| 6 | Europe | 20 |
| 7 | Middle East | 14 |
| 8 | Africa | 5 |
Asia
| wdt_ID | Region | Percentage |
|---|---|---|
| 1 | Total - Asia | 22 |
| 2 | China | 18 |
| 3 | India | 7 |
| 4 | Asia/Australia/New Zealand | 14 |
| 5 | Other | 0 |
| 6 | None | 0 |
“The one word I’ve heard a lot when it comes to healthcare is resiliency.”
—Randy Schmitgen, Flad Architects
During the next two years, does your firm expect to see more or fewer project activities in these healthcare segments?
MORE PROJECTS
LESS PROJECTS
NO CHANGE
N/A
Healthcare Project Types
Firms with Largest Increase in Fees
| wdt_ID | Firm | 2021 | 2022 |
|---|---|---|---|
| 1 | Gensler | 27,081,808 | 50,926,397 |
| 2 | EYP | 5,589,056 | 23,467,756 |
| 3 | HGA | 21,403,000 | 28,056,074 |
| 4 | Little Diversified Architectural Consulting | 4,653,200 | 10,268,060 |
| 5 | Hord Coplan Macht | 2,685,246 | 8,080,000 |
| 6 | CannonDesign | 56,000,000 | 60,000,000 |
| 7 | SmithGroup | 30,846,976 | 34,237,879 |
| 8 | Leo A Daly | 14,870,029 | 17,588,510 |
| 9 | HDR | 58,953,450 | 60,873,600 |
| 10 | Ware Malcomb | 5,655,978 | 6,766,108 |
Methodology
The first installment of the two-part annual business survey of Interior Design Giants comprises the 100 largest firms ranked by interior design fees for the 12-month period ending December 31, 2021. Interior design fees include those attributed to:
- All types of interiors work, including commercial and residential.
- All aspects of a firm’s interior design practice, from strategic planning and programming to design and project management.
- Fees paid to a firm for work performed by employees and independent contractors who are “full-time staff equivalent.” Interior design fees do not include revenues paid to a firm and remitted to subcontractors who are not considered full-time staff equivalent. For example, certain firms attract work that is subcontracted to a local firm. The originating firm may collect all the fees and retain a management or generation fee, paying the remainder to the performing firm. The amounts paid to the latter are not included in fees of the collecting firm when determining its ranking. Ties are broken by dollar value of products installed, square footage of projects installed, and staff size respectively. Where applicable, all percentages are based on responding Giants, not their total number.
more
Research
Interior Design’s 2026 Sustainability Giants Are On The Up And Up
Sustainability fees rose 10 percent to an average of 50 projects per Giants firm, while sustainability-driven FF&C specifications held steady.
Research
Introducing Interior Design’s 2026 Healthcare Giants
Healthcare Giants remain strong, with fees holding well above pre-pandemic levels as hospitals continue to lead the sector and domestic work dominates.
Research
Interior Design’s 2026 Hospitality Giants Showcase Solid Growth
Hospitality has officially completed its post-pandemic comeback, with design fees surging year over year and project activity continuing to climb.