Industry Snapshot: Interior Design’s 2026 Rising Giants
The story of 2025 for the Rising Giants is pretty much the same as for the topmost 100 firms: stability. One of the biggest positives is fee income, which climbed a modest but solid 4 percent, from $555.5 million to $578 million. This is welcome news after a slight downturn (of that same percent) last year. While it wasn’t quite the surge that Rising Giants predicted—they’d forecast a 14 percent bump-up for 2025—it’s still an all-time-high fee for this cohort. Looking ahead, they’re expecting a 10 percent rise for 2026.
The financial picture gets even brighter when you drill down. The median fee per interior design staff member, at $208,348, jumped 12 percent year-over-year and now surpasses pre-COVID levels by a margin of 4 percent. Billing rates continue their steady climb as well: up some 6 percent for principals/partners and 3 percent for project managers/directors, while designers held steady. The upshot? Across the board,Rising Giants are consistently making more money since before the pandemic, and so are the practitioners themselves. In 2025, the biggest jump was seen for project manager/directors, who enjoyed an average salary raise of 3 percent YOY, to $113,750—a sign of a competitive market for this experience level.
On the project front, overall volume held relatively steady, dipping just slightly from 21,534 to 20,834—though that figure still towers over the 12,000 projects Rising Giants completed in 2019. Better yet, these firms are anticipating a 14 percent gain for 2026. As for how those projects break down, new construction declined ever-so-slightly in comparison to renovation: two percentage points, to 43 (same as the 100 Giants). Meanwhile, the proportion of overseas projects edged up from 8 to 10 percent for these domestic-skewing studios. The Southeast and Southwest regions are expected to lead U.S. growth again this year, as they consistently have, with 95 percent of firms predicting domestic expansion.
Rising Giants 2026
| wdt_ID | wdt_created_by | wdt_created_at | wdt_last_edited_by | wdt_last_edited_at | 2026 rank | Firm | Headquarters | Design Fees (in millions) | FFC Value (in millions) | Design Staff | 2025 Rank |
|---|---|---|---|---|---|---|---|---|---|---|---|
| 1 | colsen | 25/03/2026 04:00 PM | colsen | 25/03/2026 04:00 PM | 101 | STG DESIGN | Austin, TX | 10.9 | 124.2 | 50 | 101 |
| 2 | colsen | 25/03/2026 04:00 PM | colsen | 25/03/2026 04:00 PM | 102 | KZF DESIGN | Cincinnati | 10.5 | 775.0 | 40 | 109 |
| 3 | colsen | 25/03/2026 04:00 PM | colsen | 25/03/2026 04:00 PM | 103 | MEYER DESIGN | Ardmore, PA | 10.4 | 215.0 | 58 | 111 |
| 4 | colsen | 25/03/2026 04:00 PM | colsen | 25/03/2026 04:00 PM | 104 | BLINK DESIGN GROUP | Singapore | 10.4 | 82 | n/a | |
| 5 | colsen | 25/03/2026 04:00 PM | colsen | 25/03/2026 04:00 PM | 105 | ARIA GROUP | Oak Park, IL | 10.3 | 46 | 105 | |
| 6 | colsen | 25/03/2026 04:00 PM | colsen | 25/03/2026 04:00 PM | 106 | JEFFREY BEERS INTERNATIONAL | New York | 10.2 | 85.5 | 39 | 124 |
| 7 | colsen | 25/03/2026 04:00 PM | colsen | 25/03/2026 04:00 PM | 107 | DESIGN REPUBLIC | New York | 9.9 | 450.0 | 33 | 110 |
| 8 | colsen | 25/03/2026 04:00 PM | colsen | 25/03/2026 04:00 PM | 108 | ARCHITECTURE, INCORPORATED | Reston, VA | 9.7 | 9.3 | 12 | 108 |
| 9 | colsen | 25/03/2026 04:00 PM | colsen | 25/03/2026 04:00 PM | 109 | LOONEY & ASSOCIATES | Dallas | 9.6 | 38 | 119 | |
| 10 | colsen | 25/03/2026 04:00 PM | colsen | 25/03/2026 04:00 PM | 110 | EDG INTERIOR ARCHITECTURE AND DESIGN | Novato, CA | 9.5 | 190.5 | 43 | 120 |
Note: “blank cells” = did not report data
Sector-wise, the top three moneymakers remain hospitality, workplace, and residential—which combined account for two-thirds of overall fees (Rising Giants are traditionally a bit less diversified than the 100 Giants). The biggest fee-growth segments were government (up 60 percent YOY), cultural/sport centers (50 percent), and healthcare (29 percent, though comprising a smaller slice of overall fees than in recent years). Rising Giants have also seen a nice rebound in hospitality work. The vertical is up a healthy 24 percent after a decline the previous year and currently stands at an all-time revenue high. This bounce tracks with anecdotal reporting that suggests more hotel work is going to these smaller boutique firms. Alas, workplace, which had finally hit full post-pandemic recovery in 2024, was down again. Rising Giants predict more growth in hospitality, healthcare, and government sectors for 2026, with a generally positive outlook.
FF&C value, at $16.5 billion, shot up quite significantly YOY, but we’ve seen some wild swings in this data point, since it’s easily skewed by individual firms’ numbers. As such, we don’t put overmuch stake in big fluctuations, whether in the positive and negative direction. Staffing numbers, which had pinballed up and down over the last few years, dipped across the board in 2025, specifically and most notably at the project manager/director level. This is likely a small rightsizing after the post-pandemic restaffing surge.
While 2025 was mostly steady, if a bit down in some key areas, 2026 is looking to be a solid year, given the overall stability after weathering what felt like a tumultuous 12 months. What stands out is how the RisingGiants maintained their footing even when growth fell short of ambitious forecasts: Fees hit record highs, hospitality work rebounded strongly, and firms are positioning themselves for double-digit gains ahead. For Risers, resilience continues to be the defining characteristic.
Interested in learning more about Interior Design’s 2026 Giants of Design? Check out our report for Top 100 Giants.
Giants Snapshot
- 2025 interior design firms: $578.2M
- YOY increase: 4%
- 2026 forecast: $636.5M
- FF&C value: $16.5B
- FF&C forecast: $16.4B
Projects
- 2025 project total: 20,834
- 2026 forecast: 23,846
Workplace Trends
Reflecting a broader shift toward experience-driven spaces, the hospitality influence is continuing to drive workplace design, with firms incorporating elements like lounges, cafés, and elevated finishes to entice remote workers back. Flexibility remains paramount, manifesting in adaptable furniture and spaces that users can modify, free-address seating, and varied work settings—all of which help justify real estate costs while supporting hybrid work patterns. As budget pressures mount, firms are ramping up their focus on maximizing value. Meanwhile, digital integration is transforming both physical spaces and project execution, with virtual collaboration tools both accelerating design processes and increasing the demand for tech-enabled environments.
Segment Income and Number of Projects Worked On
| wdt_ID | wdt_created_by | wdt_created_at | wdt_last_edited_by | wdt_last_edited_at | Segment | Fees In Millions (2025 actual) | Fees In Millions (2026 forecast) | Projects (2025 actual) | Projects (2026 forecast) |
|---|---|---|---|---|---|---|---|---|---|
| 1 | colsen | 25/03/2026 05:37 PM | colsen | 25/03/2026 05:37 PM | Hospitality/restaurant | 190.1 | 206.4 | 3,202.00 | 3,831.00 |
| 2 | colsen | 25/03/2026 05:37 PM | colsen | 25/03/2026 05:37 PM | Workplace | 110.8 | 119.1 | 5,321.00 | 5,991.00 |
| 3 | colsen | 25/03/2026 05:37 PM | colsen | 25/03/2026 05:37 PM | Residential/multifamily | 86.4 | 94.0 | 1,741.00 | 2,036.00 |
| 4 | colsen | 25/03/2026 05:37 PM | colsen | 25/03/2026 05:37 PM | Healthcare/wellness | 39.5 | 44.4 | 1,852.00 | 2,179.00 |
| 5 | colsen | 25/03/2026 05:37 PM | colsen | 25/03/2026 05:37 PM | Education | 32.1 | 33.6 | 1,162.00 | 1,223.00 |
| 6 | colsen | 25/03/2026 05:37 PM | colsen | 25/03/2026 05:37 PM | Government/civic | 29.9 | 30.6 | 1,458.00 | 1,483.00 |
| 7 | colsen | 25/03/2026 05:37 PM | colsen | 25/03/2026 05:37 PM | Retail | 26.0 | 31.1 | 1,263.00 | 1,561.00 |
| 8 | colsen | 25/03/2026 05:37 PM | colsen | 25/03/2026 05:37 PM | Senior living | 16.4 | 18.3 | 1,233.00 | 1,450.00 |
| 9 | colsen | 25/03/2026 05:37 PM | colsen | 25/03/2026 05:37 PM | Cultural/sports center | 14.9 | 15.8 | 646.00 | 649.00 |
| 10 | colsen | 25/03/2026 05:37 PM | colsen | 25/03/2026 05:37 PM | Mixed-use | 8.7 | 10.8 | 497.00 | 574.00 |
| 11 | colsen | 25/03/2026 05:37 PM | colsen | 25/03/2026 05:37 PM | Life science | 5.5 | 7.2 | 820.00 | 828.00 |
| 12 | colsen | 25/03/2026 05:37 PM | colsen | 25/03/2026 05:37 PM | Manufacturing/warehouse | 4.8 | 6.0 | 670.00 | 783.00 |
| 13 | colsen | 25/03/2026 05:37 PM | colsen | 25/03/2026 05:37 PM | Transportation | 2.8 | 2.6 | 351.00 | 401.00 |
| 14 | colsen | 25/03/2026 05:37 PM | colsen | 25/03/2026 05:37 PM | Data centers/mission critical | 1.4 | 1.1 | 201.00 | 299.00 |
| 15 | colsen | 25/03/2026 05:37 PM | colsen | 25/03/2026 05:37 PM | Other | 9.1 | 9.6 | 417.00 | 558.00 |
Segment Change Over Time
| wdt_ID | wdt_created_by | wdt_created_at | wdt_last_edited_by | wdt_last_edited_at | Segment | % of 2025 fees | 2025 vs 2024 change | 2025 vs 2019 change |
|---|---|---|---|---|---|---|---|---|
| 1 | colsen | 25/03/2026 06:02 PM | colsen | 25/03/2026 06:02 PM | Hospitality/restaurant | 33 | 24 | 19 |
| 2 | colsen | 25/03/2026 06:02 PM | colsen | 25/03/2026 06:02 PM | Workplace | 19 | -29 | -28 |
| 3 | colsen | 25/03/2026 06:02 PM | colsen | 25/03/2026 06:02 PM | Residential/multifamily | 15 | 13 | 109 |
| 4 | colsen | 25/03/2026 06:02 PM | colsen | 25/03/2026 06:02 PM | Healthcare/wellness | 7 | 29 | -37 |
| 5 | colsen | 25/03/2026 06:02 PM | colsen | 25/03/2026 06:02 PM | Education | 6 | 0 | 73 |
| 6 | colsen | 25/03/2026 06:02 PM | colsen | 25/03/2026 06:02 PM | Government/civic | 5 | 60 | 133 |
| 7 | colsen | 25/03/2026 06:02 PM | colsen | 25/03/2026 06:02 PM | Retail | 5 | 5 | -15 |
| 8 | colsen | 25/03/2026 06:02 PM | colsen | 25/03/2026 06:02 PM | Cultural/sports Center | 3 | 50 | 132 |
| 9 | colsen | 25/03/2026 06:02 PM | colsen | 25/03/2026 06:02 PM | Transportation | 1 | -68 | 44 |
Most Admired Firms
Editor’s Note: Take a look at recent coverage of our Rising Giants most admired firms of 2025 below. Rockwell Group tops the list followed by AvroKO, Meyer Davis and Yabu Pushelberg, as well as Perkins&Will, Studio Munge and Olson Kundig.
Read About Projects By The Most Admired Firms
Projects
Rockwell Group Reimagines W Hollywood With Theatricality
Explore how Rockwell Group transforms W Hollywood into a showstopping spectacle with a rich layering of materiality and texture, and high-quality lighting.
Projects
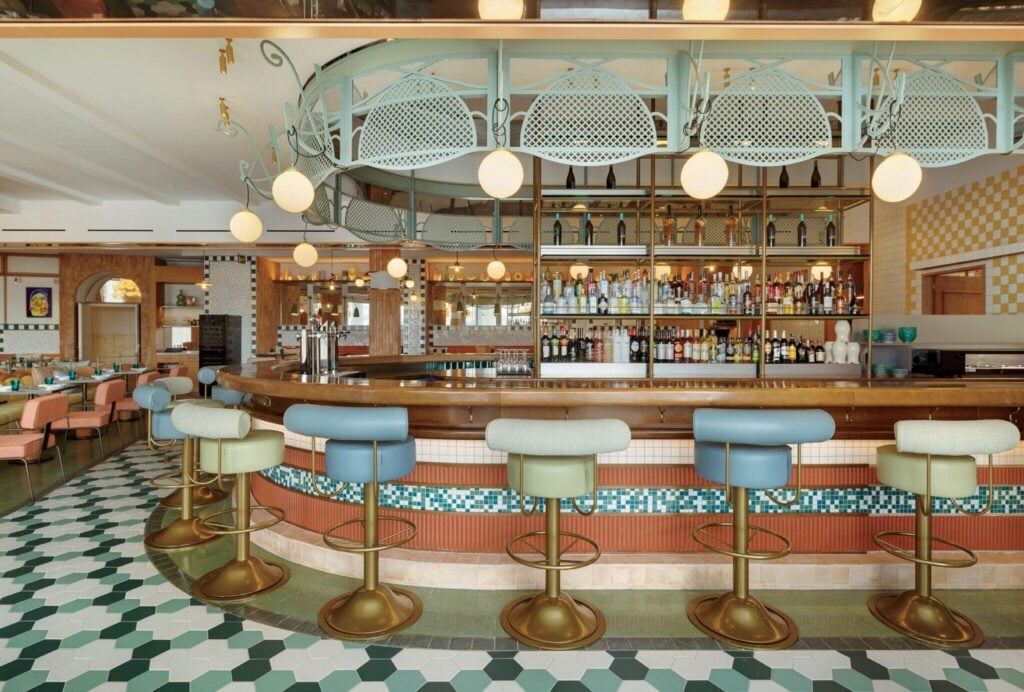
AvroKO Redefines The Hotel Restaurant With High-Style Interiors
At the SLS Barcelona, AvroKO has cooked up an instant neighborhood classic in L’Anxova Divina, a 3,600-square-foot tapas bar.

Projects
Meyer Davis Studio Brings Signature Glamour to Poltu Quatu, Italy
Having worked their magic on the vivacious W Rome, Will Meyer and Gray Davis have reprised the brand collaboration, this time in coastal Sardinia.
firms with most design fee growth (in millions)
| wdt_ID | wdt_created_by | wdt_created_at | wdt_last_edited_by | wdt_last_edited_at | Firm | 2024 Fees | 2025 Fees | Increase |
|---|---|---|---|---|---|---|---|---|
| 1 | colsen | 25/03/2026 04:40 PM | colsen | 25/03/2026 04:40 PM | GH2 Architects | 4.9 | 7.7 | 2.8 |
| 2 | colsen | 25/03/2026 04:40 PM | colsen | 25/03/2026 04:40 PM | Jeffrey Beers International | 7.5 | 10.2 | 2.7 |
| 3 | colsen | 25/03/2026 04:40 PM | colsen | 25/03/2026 04:40 PM | The Miller Hull Partnership | 4.9 | 7.2 | 2.3 |
| 4 | colsen | 25/03/2026 04:40 PM | colsen | 25/03/2026 04:40 PM | Premier | 5.6 | 7.7 | 2.1 |
| 5 | colsen | 25/03/2026 04:40 PM | colsen | 25/03/2026 04:40 PM | Clark Nexsen, a JMT Company | 2.5 | 4.5 | 2.0 |
| 6 | colsen | 25/03/2026 04:40 PM | colsen | 25/03/2026 04:40 PM | Philpotts Interiors | 3.7 | 5.5 | 1.8 |
| 7 | colsen | 25/03/2026 04:40 PM | colsen | 25/03/2026 04:40 PM | EDG Interior Architecture and Design | 7.8 | 9.5 | 1.8 |
| 8 | colsen | 25/03/2026 04:40 PM | colsen | 25/03/2026 04:40 PM | The Society | 1.9 | 3.6 | 1.7 |
| 9 | colsen | 25/03/2026 04:40 PM | colsen | 25/03/2026 04:40 PM | Looney & Associates | 8.0 | 9.6 | 1.6 |
| 10 | colsen | 25/03/2026 04:40 PM | colsen | 25/03/2026 04:40 PM | Rodrigo Vargas Design | 7.0 | 8.6 | 1.6 |
All Together Now
Rising Giants are reimagining the workplace as a catalyst for connection. The emerging measure of success? Emotional engagement and team energy rather than utilization rate. With hybrid schedules entrenched and fluctuating occupancy prevalent, in-person time is precious, fueling demand for high-impact collaboration zones, mentorship-supportive spaces, and hospitality-inspired amenities that encourage belonging and recharging. Firms believe the most effective offices are grounded in behavioral insights, conceived to balance focus and interaction. Technology is also giving designers an edge, with AI-driven planning tools, sensor-informed environmental tuning, and more sophisticated acoustical integration reshaping infrastructure.
ID Fees Per Employee
| wdt_ID | wdt_created_by | wdt_created_at | wdt_last_edited_by | wdt_last_edited_at | Year | Fees | YOY Change |
|---|---|---|---|---|---|---|---|
| 1 | colsen | 26/03/2026 08:43 AM | colsen | 26/03/2026 08:43 AM | 2025 | 208,348.00 | 12 |
| 2 | colsen | 26/03/2026 08:43 AM | colsen | 26/03/2026 08:43 AM | 2024 | 185,898.00 | 2 |
| 3 | colsen | 26/03/2026 08:43 AM | colsen | 26/03/2026 08:43 AM | 2023 | 182,857.00 | 10 |
| 4 | colsen | 26/03/2026 08:43 AM | colsen | 26/03/2026 08:43 AM | 2022 | 166,410.00 | 17 |
| 5 | colsen | 26/03/2026 08:43 AM | colsen | 26/03/2026 08:43 AM | 2021 | 142,619.00 | -20 |
| 6 | colsen | 26/03/2026 08:43 AM | colsen | 26/03/2026 08:43 AM | 2020 | 177,379.00 | -11 |
| 7 | colsen | 26/03/2026 08:43 AM | colsen | 26/03/2026 08:43 AM | 2019 | 200,284.00 |
After a post-pandemic dip, ID fees per employee are $208,348 up 4% compared to the 2019 baseline—and 12% year-over-year.
More From The Most Admired Firms
Projects
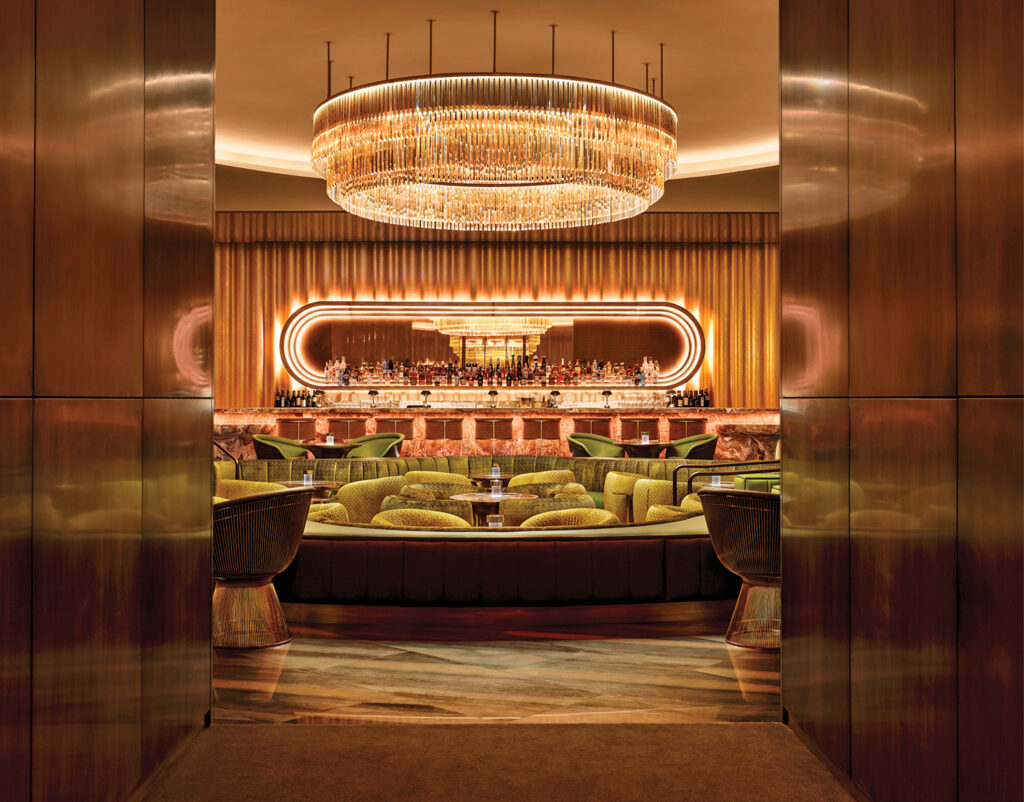
Yabu Pushelberg Designs A Vegas Nightclub For Bruno Mars
The Rat Pack meets modern glam at The Pinky Ring, Bruno Mars’s penthouse-inspired nightclub by Yabu Pushelberg inside Vegas’s Bellagio.
Projects
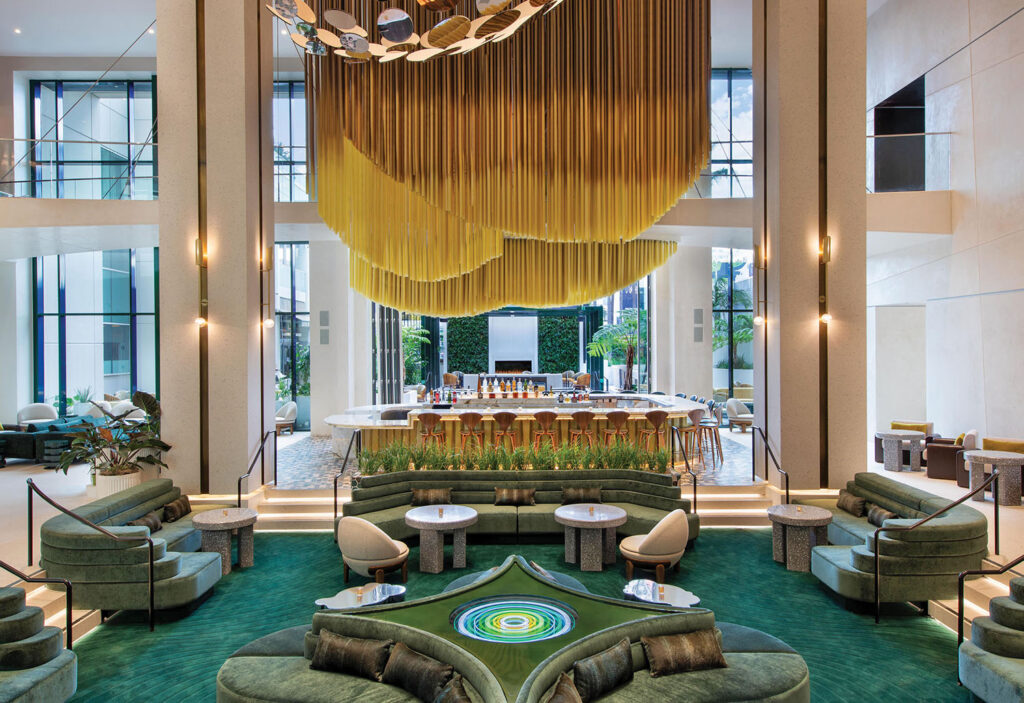
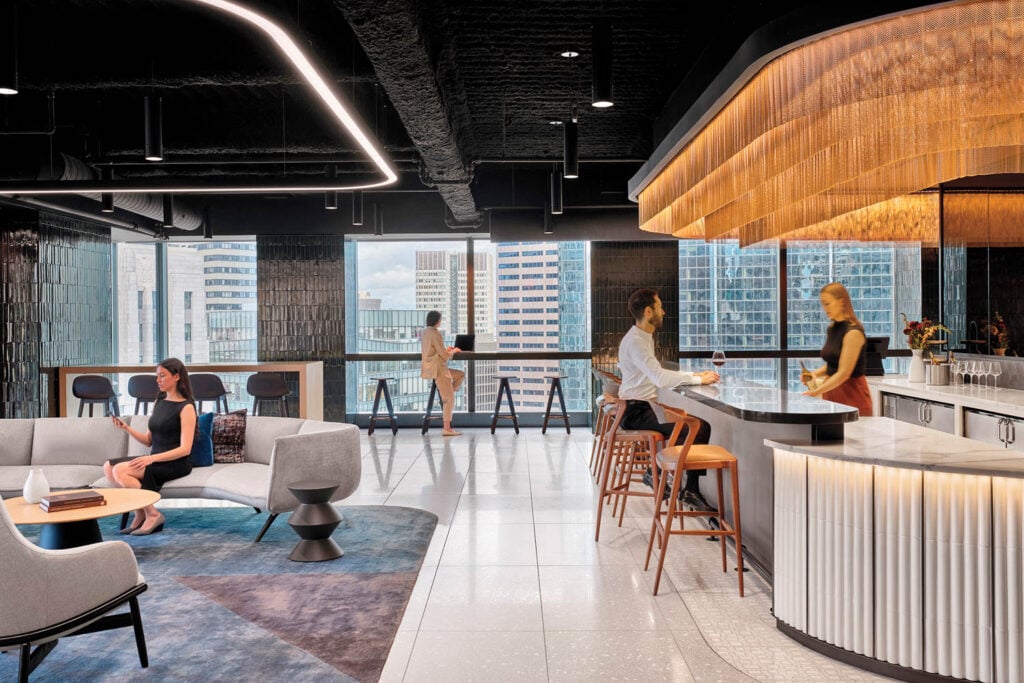
A Downtown HQ By Gensler Channels The Spirit Of A Social Club
This Boston financial firm HQ by Gensler reimagines workplaces as a hospitality-driven third space, with a café crowned by a gold wire-mesh installation.
Projects
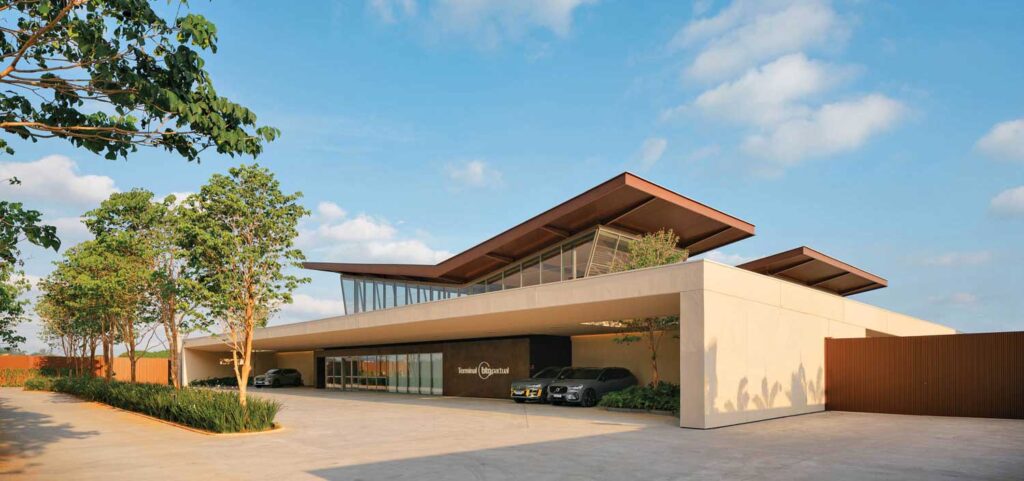
Quiet Opulence Lands at São Paulo Airport’s VIP Terminal
At São Paulo’s Guarulhos International Airport, the BTG Pactual VIP Terminal by Pascali Semerdjian Arquitetos and Perkins&Will offers travelers a luxe haven.
Business Challenges
Rising Giants report that economic volatility is reshaping the project process. Tightened capital, high costs, and construction escalation have compressed schedules and heightened scrutiny at every phase. Tariffs and global market fluctuations are limiting spec options, extending lead times, and making short-term cycles unpredictable. Labor shortages compound delays while influencing material selections, pushing teams toward solutions that maximize efficiency and reduce maintenance. In response, these firms are recalibrating. Strategies include delivering realistic FF&E budgets earlier in the design phase to manage expectations and avoid sticker shock, re-thinking sourcing strategies to build in flexibility and hedge against trade disruptions, and leveraging design visuals to secure additional funding before proceeding. The result is a more strategic, front-loaded process that prioritizes long-term durability and operational savings without sacrificing any personality.
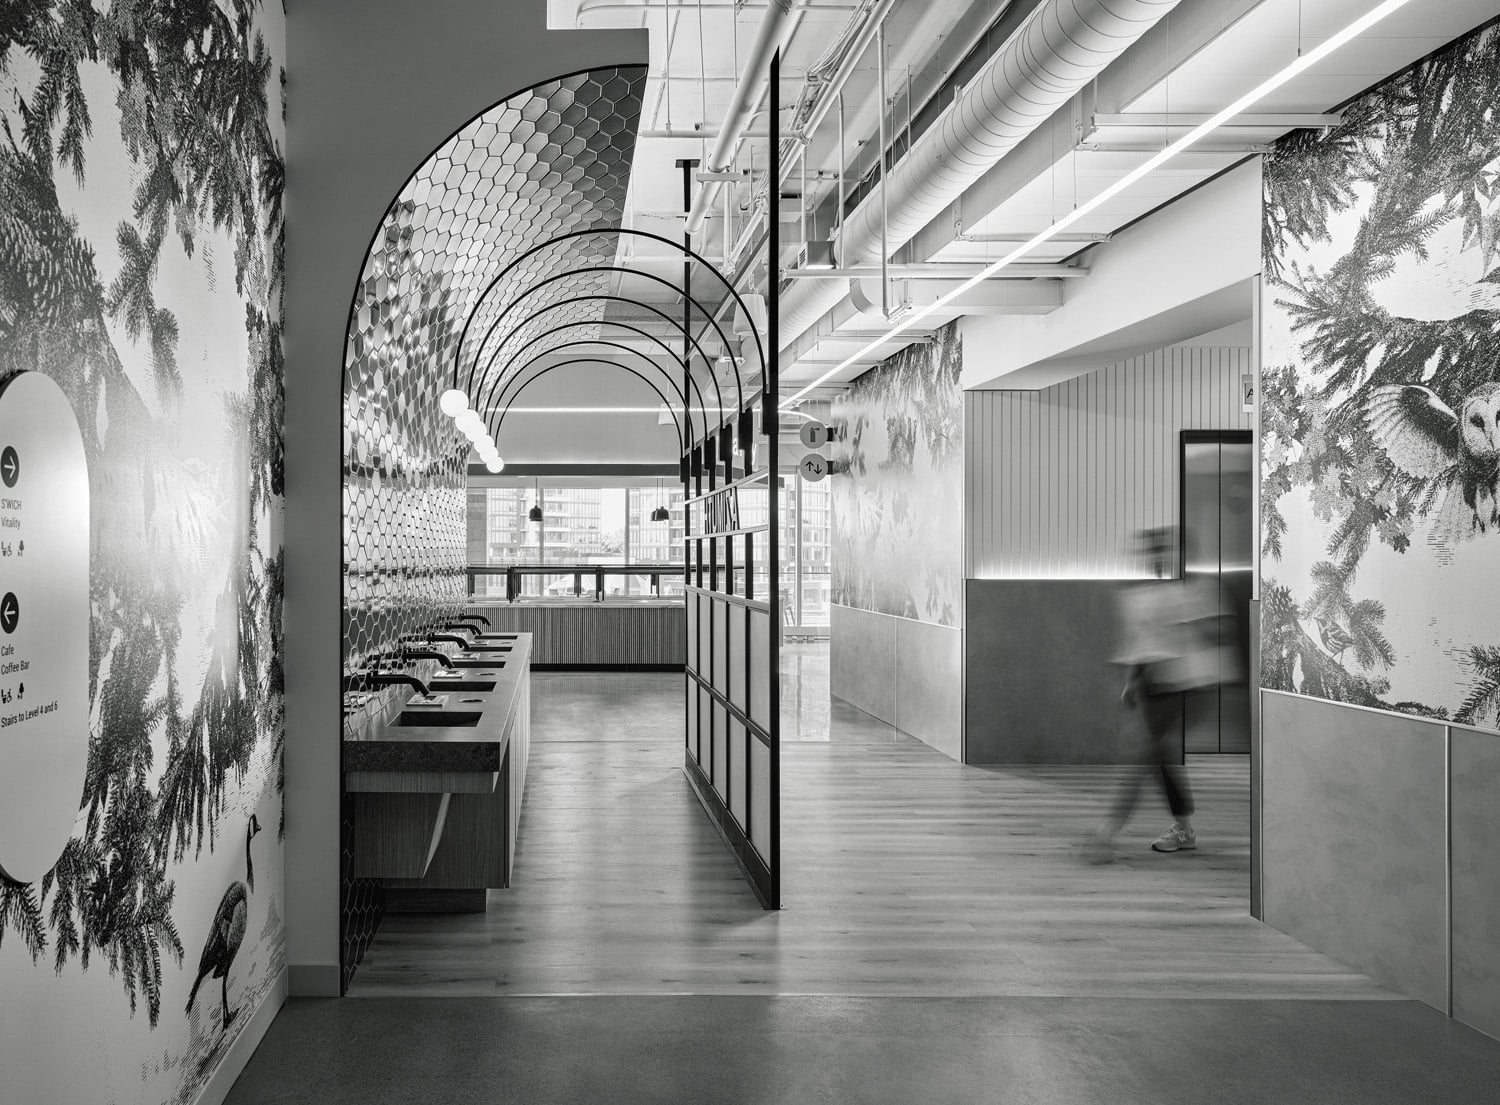
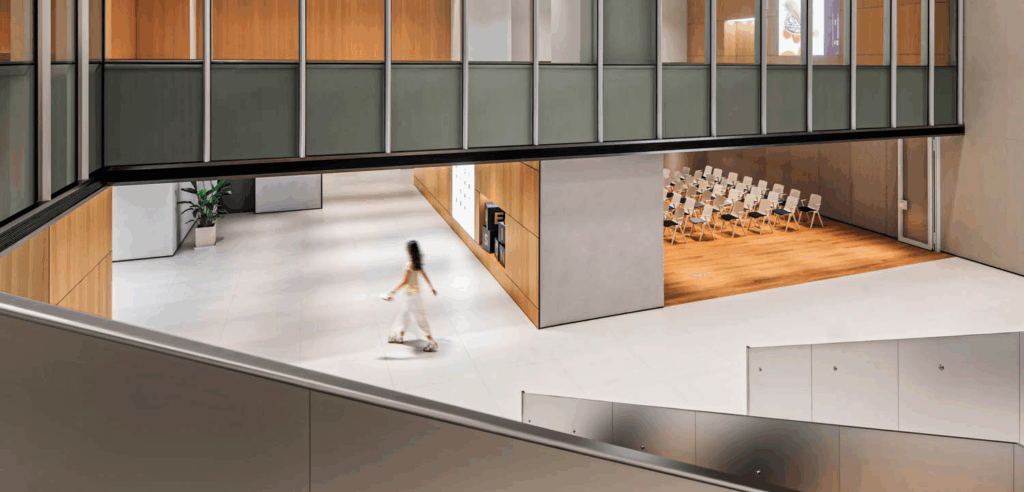
Google BRT3 workplace in Kitchener, Canada, by InStudio [150]. Photography by Christian Lalonde. 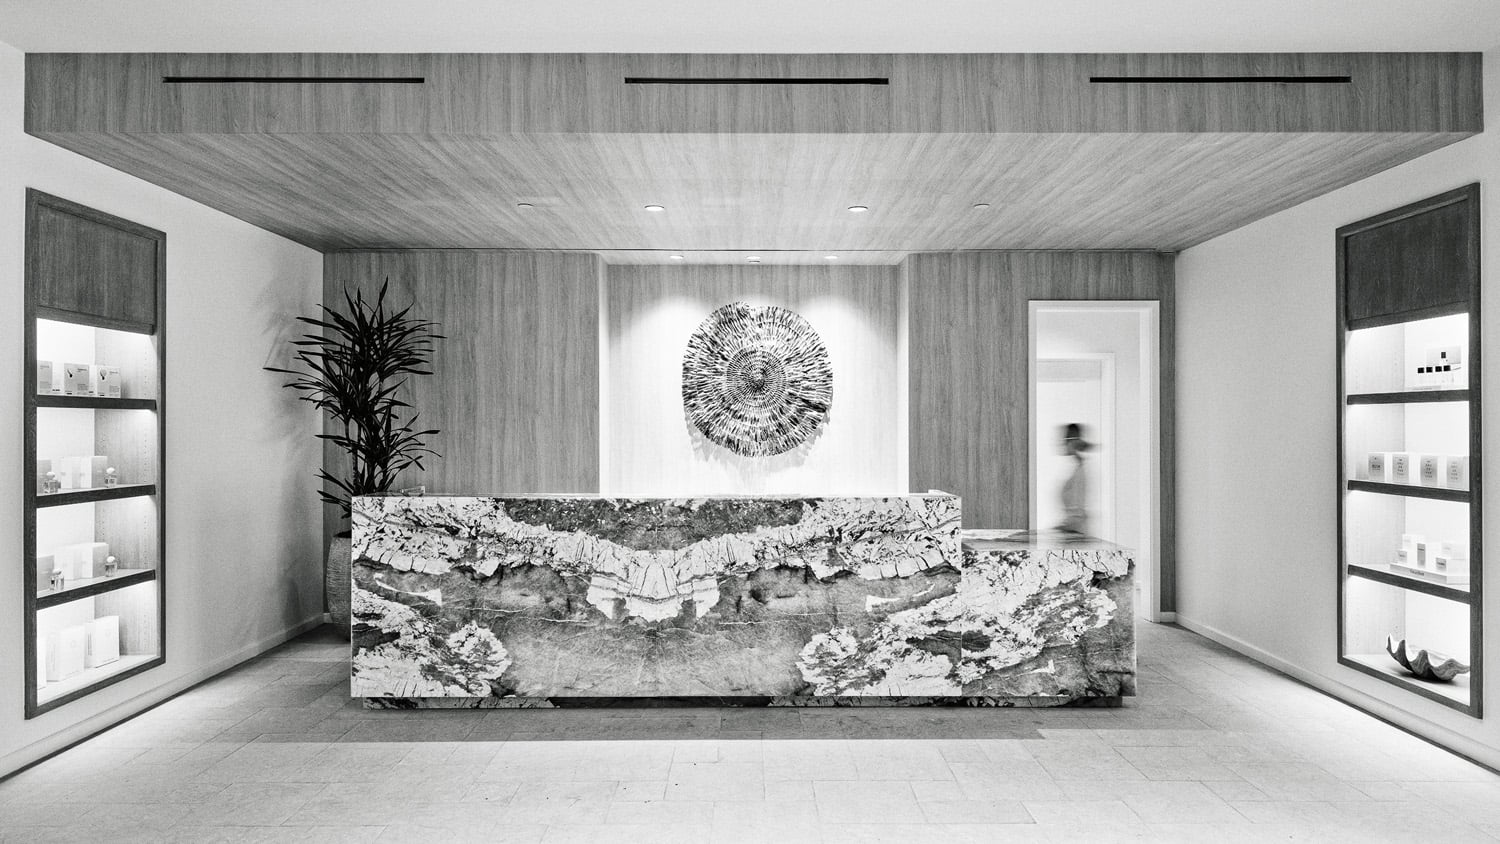
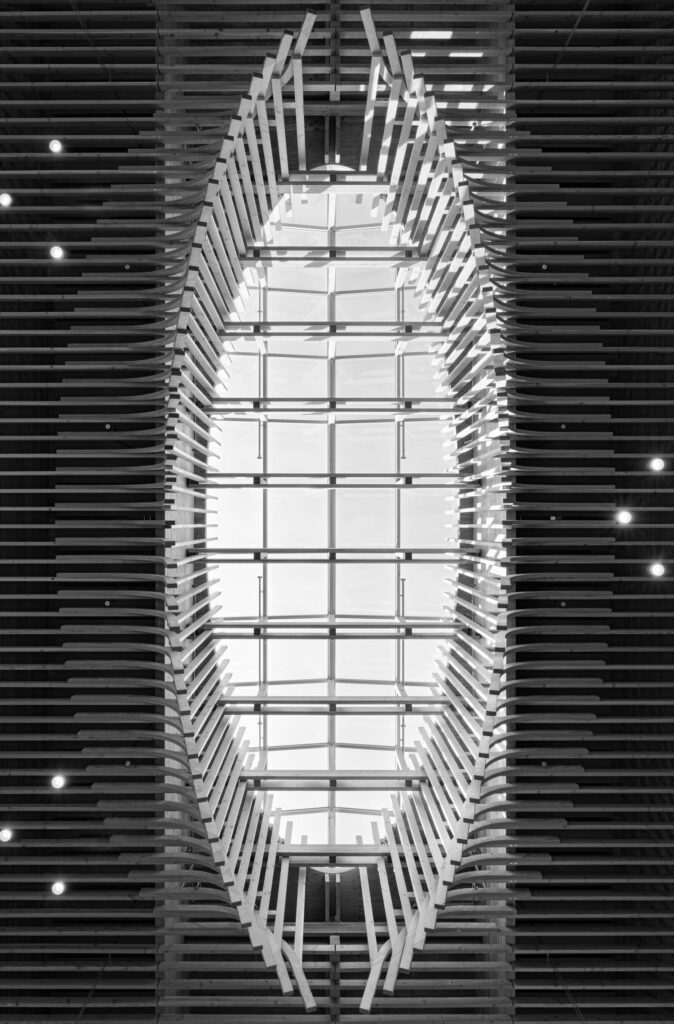
The Spa at Terranea in Rancho Palos Verdes, California, by Rodrigo Vargas Design [120]. Photography courtesy of Rodrigo Vargas Design. 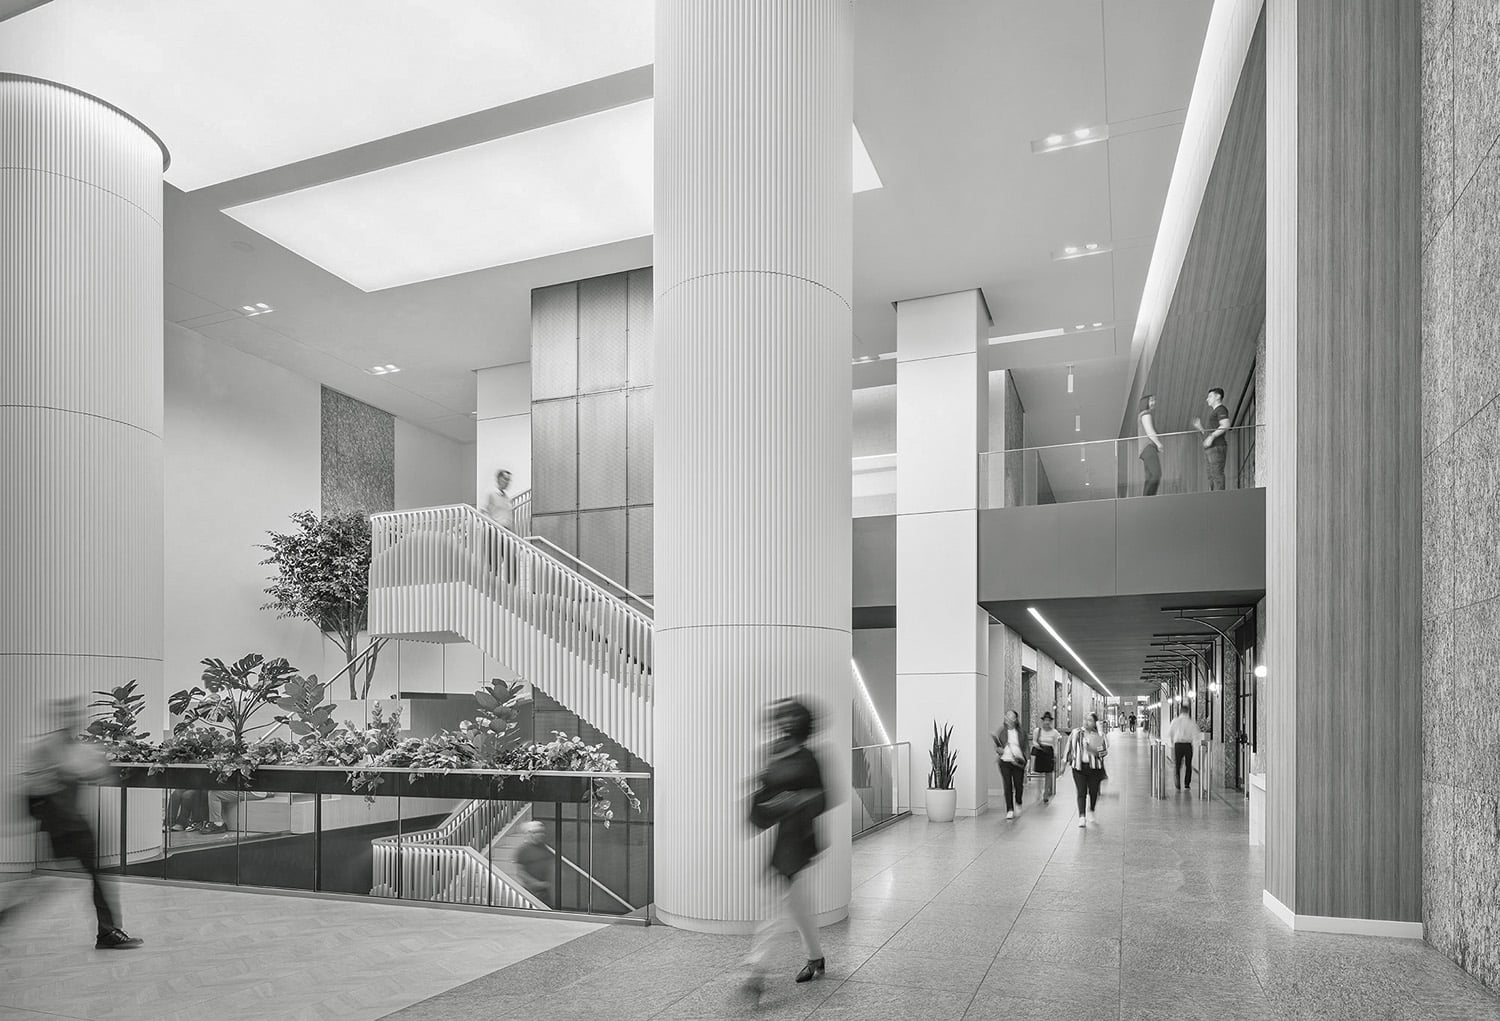
55 East Monroe Street, Chicago, by Intec Group [184]. Photography by Darris Harris.
Projects By Type
Domestic vs. International
New Construction vs. Renovation
Staffing Information
| wdt_ID | wdt_created_by | wdt_created_at | wdt_last_edited_by | wdt_last_edited_at | Staff Type | Employee Totals | Median Hourly Rate | Median Salary |
|---|---|---|---|---|---|---|---|---|
| 1 | colsen | 26/03/2026 09:14 AM | colsen | 26/03/2026 09:14 AM | Principals/partners | 601 | 282 | 180,000.00 |
| 2 | colsen | 26/03/2026 09:14 AM | colsen | 26/03/2026 09:14 AM | Project manager/directors | 871 | 191 | 113,750.00 |
| 3 | colsen | 26/03/2026 09:14 AM | colsen | 26/03/2026 09:14 AM | Designers | 1,441 | 150 | 77,027.00 |
| 4 | colsen | 26/03/2026 09:14 AM | colsen | 26/03/2026 09:14 AM | Other interior design staff | 330 | ||
| 5 | colsen | 26/03/2026 09:14 AM | colsen | 26/03/2026 09:14 AM | Non-ID staff | 3,390 |
Note: “blank cells” = did not report data
Total Employees
| wdt_ID | wdt_created_by | wdt_created_at | wdt_last_edited_by | wdt_last_edited_at | Staffing at a Glance | Total |
|---|---|---|---|---|---|---|
| 1 | colsen | 26/03/2026 09:04 AM | colsen | 26/03/2026 09:04 AM | Interior design staff | 3,243 |
| 2 | colsen | 26/03/2026 09:04 AM | colsen | 26/03/2026 09:04 AM | Non-ID staff | 3,390 |
| 3 | colsen | 26/03/2026 09:04 AM | colsen | 26/03/2026 09:04 AM | Total employees | 6,633 |
Methodology
The Interior Design Giants of Design annual business survey comprises the largest firms ranked by interior design fees for the 12-month period ending December 31, 2025. The listings are generated from only those surveyed. To be recognized as a top 100, Rising, Healthcare, Hospitality, or Sustainability Giant, you must meet the following criteria: Have at least one office location in North America and generate at least 25 percent of your interior design fee income in North America. Firms that do not meet the criteria are ranked on our International Giants list. Interior design fees include those attributed to:
1. All aspects of a firm’s interior design practice, from strategic planning and programming to design and project management.
2. Fees paid to a firm for work performed by employees and independent contractors who are “full-time staff equivalent.”
Interior design fees do not include revenues paid to a firm and remitted to subcontractors who are not considered full-time staff equivalent. For example, certain firms attract work that is subcontracted to a local firm. The originating firm may collect all the fees and retain a management or generation fee, paying the remainder to the performing firm. The amounts paid to the latter are not included in fees of the collecting firm when determining its ranking. Ties are broken by rank from last year. Where applicable, all percent ages are based on responding Giants, not their total number.
All research conducted by ThinkLab, the research division of SANDOW Design Group.
read more
Research
A Look At Interior Design’s 2026 Top 100 Giants
Interior Design’s 2026 Top 100 Giants tells a story of resilience as the industry’s most prominent firms continue to adapt and thrive.
Research
A Spotlight on Interior Design’s 2025 Healthcare Giants
Interior Design’s Healthcare Giants surged ahead with steady momentum in 2025, marking a year of impressive growth and reinforcing the sector’s momentum.
Research
Revealing Interior Design’s 2025 Sustainability Giants
Discover how sustainability-driven firms are designing with both people and planet in mind with Interior Design’s 2025 Sustainability Giants.