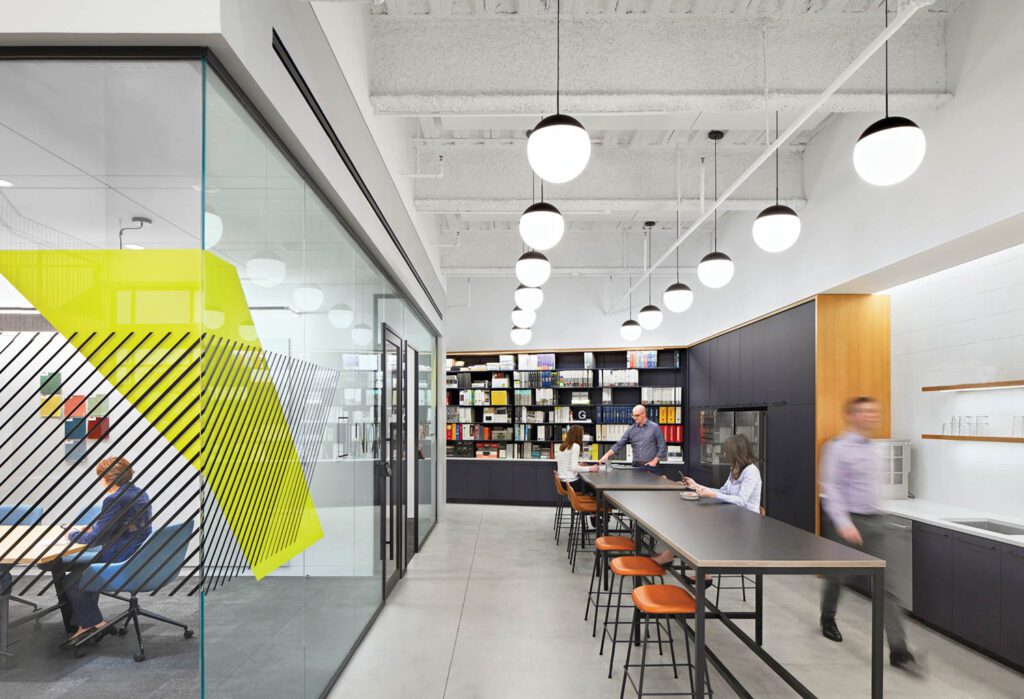
![CBRE’s New England headquarters in Boston is by Elkus Manfredi [47]. ZGF [18] designed an office for a confidential client in Irvine, California. Photography by Connie Zhou.](https://interiordesign.net/wp-content/uploads/2022/02/Interior-Design-Top-100-Giants-idx220201_giants01-1024x683.jpg)
February 16, 2022
Interior Design Unveils the Top 100 Giants 2022
If there’s one word to describe the current state of the interior design industry. . . Well, we don’t know what it is, but, for starters, it’s looking better. COVID-19 and its fallout threw firms across the country into uncertainty. As we enter the third year of the pandemic, however, U.S. unemployment is way down, and economic indicators are way up. But, as of this writing, virus-case figures are back on the rise, thanks to the Omicron variant. Exhausted yet? Yeah, us too. As we perused the new set of business trend data for our annual look at the firms composing the Interior Design Top 100 Giants, we saw a bit of everything, including some very good news.
Rankings
| wdt_ID | 2022 Ranking | Firm | HQ Location | 2021 Design Fees (in millions) | 2021 FFC Value (in millions) | 2021 Sq. Ft. (in millions) | 2021 Rank | 2021 ID Staff |
|---|---|---|---|---|---|---|---|---|
| 1 | 1 | Gensler | San Francisco | 545.69 | 1 | 3,073 | ||
| 2 | 2 | Jacobs Engineering Group | Dallas | 308.27 | 6,743.35 | 38.50 | 2 | 1,204 |
| 3 | 3 | Perkins&Will | Chicago | 188.00 | 6,200.00 | 55.00 | 4 | 396 |
| 4 | 4 | AECOM | Dallas | 184.21 | 7,090.77 | 3 | 459 | |
| 5 | 4A | Gold Mantis Construction Decoration Co. | Suzhou | 171.60 | 4,695.60 | |||
| 6 | 5 | HOK | New York | 151.29 | 4,700.00 | 53.00 | 6 | 290 |
| 7 | 6 | IA Interior Architects | San Francisco | 128.80 | 2,800.00 | 43.10 | 8 | 526 |
| 8 | 6A | Cheng Chung Design (HK) Ltd. | Shenzhen | 119.27 | 57.00 | 471.50 | 1,556 | |
| 9 | 7 | Stantec | Edmonton | 116.79 | 11 | 693 | ||
| 10 | 8 | NELSON Worldwide | Minneapolis | 110.58 | 5 |
*A: International design firms without a North American office

Submit Now for Interior Design‘s Giants of Design
Apply to be recognized in Interior Design’s prestigious Giants of Design rankings.
International Rankings
| wdt_ID | 2022 Ranking | Firm | HQ Location | 2021 Design Fees (in millions) | 2021 FFC Value (in millions) | 2021 Sq. Ft. (in millions) | 2021 Rank | 2021 ID Staff |
|---|---|---|---|---|---|---|---|---|
| 1 | 1 | Gold Mantis Construction Decoration Co. | Suzhou | 171.60 | 4,695.60 | |||
| 2 | 2 | Cheng Chung Design (HK) Ltd. | Shenzhen | 119.27 | 57.00 | 471.50 | 1,556 | |
| 3 | 3 | Matrix Design Co. | Shenzhen | 75.00 | 34.50 | |||
| 4 | 4 | M Moser Associates | Hong Kong | 69.62 | 810.04 | 19 | 968 | |
| 5 | 5 | Steve Leung Design Group | Hong Kong | 64.85 | 14.92 | 24.30 | 393 | |
| 6 | 6 | Space Matrix Design Consultants | Singapore | 36.34 | 481.00 | 9.40 | 36 | 365 |
| 7 | 7 | YiTian Design Group | Wuhan | 33.52 | ||||
| 8 | 8 | DSP Design Associates | Mumbai | 28.72 | 450.36 | 6.70 | 323 | |
| 9 | 9 | BDP | Manchester | 12.60 | 3,305.70 | 15.00 | 91 | 1,215 |
| 10 | 10 | MCX Interior | Singapore | 10.00 | 8.40 | New | 50 |
Total 2021 design fees for these largest firms came in at $4.55 billion. That’s up from last year, but only slightly. Before COVID hit, 2019 was a record year at $4.9 billion, then 2020 dropped to $4.5 billion, and with 2021’s figures, well, the Giants just scored over $9 billion for the two years of the pandemic. Would that number be higher if the virus never existed? Definitely. But given what the world has gone through, it’s hard to hate on those results.
Firms with Most Fee Growth
| wdt_ID | Firms with Most Fee Growth | 2021 Design Fees | 2020 Design Fees |
|---|---|---|---|
| 1 | Jacobs Engineering Group | 308,267,536 | 213,638,267 |
| 2 | Populous | 58,280,949 | 22,547,270 |
| 3 | Rockwell Group | 42,689,698 | 23,000,000 |
| 4 | Stantec | 116,785,425 | 97,832,591 |
| 5 | NBBJ | 78,000,000 | 61,000,000 |
| 6 | STUDIOS Architecture | 47,867,699 | 34,460,000 |
| 7 | Flad Architects | 67,185,000 | 54,225,000 |
| 8 | B+H Architects | 27,753,569 | 17,090,249 |
| 9 | CannonDesign | 110,000,000 | 101,000,000 |
| 10 | HGA | 59,150,000 | 52,202,500 |
Project Types
Break that $4.55 billion down by sector and you start to see how business has shifted. Corporate office work has always accounted for a third or more of the Giants’ overall fees, and they came in just about even to 2020’s numbers at $1.55 billion. Right before the pandemic, the corporate total was pushing $2 billion. This alone accounts for the biggest change in overall business. With the 2022 forecast at $1.53 billion, the Giants don’t expect this to change, but they do see increases in tech installation and coworking spaces.
Another sector worth noting: healthcare. It has moved up to become the second largest by fees—a slot it’s never held before, as it’s usually occupied by hospitality. But it’s one of the mixed blessings of the pandemic, which has brought rare, but intuitive, growth for this category: $598 million in 2019, $667 million in 2020, and $715 million in 2021.
Fees by Project Types
Corporate was 35 percent of overall fees but accounted for 41 percent of total projects. Meanwhile, hospitality accounted for only 6 percent of the annual job total while delivering 10 percent of total fees. Healthcare performed similarly: 11 percent of total projects tallying 16 percent of overall fees. So, while corporate work is critical and by far the biggest work sector, it hasn’t been nearly as lucrative per job as healthcare and hospitality.
While corporate and hospitality have long ways to go to reach pre-pandemic fee levels, healthcare and smaller sectors like government, education, and retail have all performed better than their pre-pandemic numbers. Government fees, for example, spiked to $425 million in 2021, up from $336 million (which was up from $285 million in 2019). Firms expect most new government work in 2022 to come from offices, hospitals, and laboratories.
Education is a $310 million-a-year business but retail is the only segment other than hospitality forecasted for 2022 growth, a hopeful 9 percent gain. Meanwhile, the residential sector has been an adventure. If you recall, that work rose to $373 million in 2019 (it had already gone up between 2017 and 2018). But in 2021, it retreated to $214 million. Possible explanation: Firms may have jumped into smaller residential jobs early in the pandemic to help keep the lights on but have now moved on. But in this sector, the Giants expect condo/mixed-use residential work to grow the most in 2022.
Another notable business shift: For the first time since 2004, new construction dropped below 50 percent of total work, to 48 percent; 10 years ago it was 56 percent. The work seems to have shifted to refreshes, which have almost doubled to 8 percent, and renovations, at 45 percent up from 40.
Project Locations
Fees per square foot jumped 32 percent to $129 from $89, but the Giants’ total number of jobs dropped to 65,000 from 71,000. That number is expected to remain steady in 2022. Furniture & fixtures and construction products installed came in at $75.4 billion, up slightly from $73.6 billion a year ago. The Giants’ original forecast was $69.8 billion, so by that measure it was a great year. The breakdown between F&F and construction remains steady around 34/66—and that breakdown hasn’t really changed in five years.
Fees per design staffer held steady from 2020 with a median of $224,000, down only $3,000. Fees-per-hour billing rates have remained nearly the same for two years, with principals/partners at $275, project managers/directors at $200, and designers at $145. The majority of firms bill more than 80 percent of their designers’ time. Annual salaries all went up: principals/partners at $184,000 from $175,000, project managers/directors at $125,000 from $107,000, and designers at $80,000 from $73,500.
Editor’s Note: Take a look at recent coverage of our Top 100 Giants most admired firms of 2022 below. Gensler tops the list followed by Perkins&Will, HOK, and Yabu Pushelberg.
Read More About Gensler
Projects
Gensler Takes a Transparent Approach to Designing its Raleigh, North Carolina Locale
2021 Best of Year winner for Firm’s Own Domestic Office. Transparency in both the workplace and design is the governing precept Gensler took for its Raleigh-Durham office. The 6,400-square-foot, two-story studio, peppere…
DesignWire
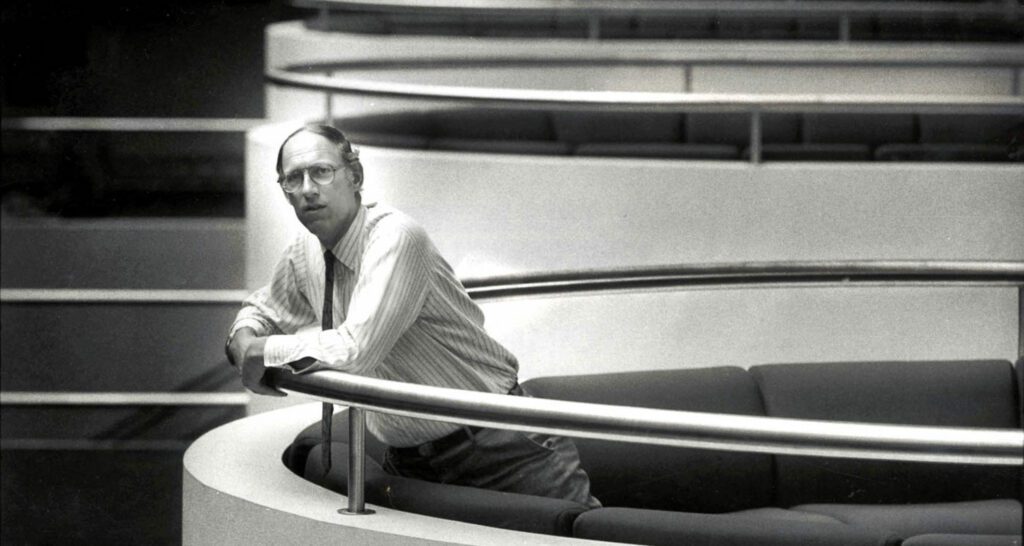
A Tribute to Art Gensler and the Monumental Impact of His Legacy
A tribute to Art Gensler’s illustrious career honors his firm’s role in shaping the future of global design — and the environments defining its cutting edge.

Projects
Gensler Answers the Call for Safe and Stylish Outdoor Dining in Baltimore
2021 Best of Year winner for Outdoor Dining. Gensler’s contribution to the pandemic-influenced Design for Distancing challenge saw 20 volunteers from its Baltimore office spend 630 hours transforming the 1700 Block of …
Annual Salary
| wdt_ID | Title | Annual Salary |
|---|---|---|
| 1 | Principals/Partners | 184,000 |
| 2 | Project Managers | 124,950 |
| 3 | Designers | 80,000 |
| 4 | Other Design Staff | 62,000 |
Hourly Rate
| wdt_ID | Title | Hourly Rate |
|---|---|---|
| 1 | Principals/Partners | 275 |
| 2 | Project Managers | 200 |
| 3 | Designers | 145 |
| 4 | Other Design Staff | 118 |
The fee forecast for 2022 is $4.3 billion, down a bit from this year, but still a firm stack of cash. The Giants have gotten pretty good at forecasting, as their guesses at total fees haven’t been off by more than couple percentage points since the pandemic began. Their confidence in forecasting is also high: Six out of 10 are “confident,” with another 28 percent “very or extremely confident” in their predictions.
So, all that gives a helpful snapshot of 2021. But what should we expect in 2022? The 100 Giants seem to think more of the same. Yes, there’s uncertainty, but the economy is also on fire. Yes, Omicron ensures the pandemic will last at least for the first quarter, but the rest of the year could see big improvements. To wit, a healthy 17 percent of the Giants plan to open new offices in the coming year.
Business Challenges
| wdt_ID | Business Challenges | Percentage |
|---|---|---|
| 1 | Earning appropriate fees | 66 |
| 2 | Dealing with clients' increasing demands | 56 |
| 3 | Increasing interference from client's consultants | 16 |
| 4 | Creating cutting edge design solutions | 9 |
| 5 | Managing the growing needs for sustainable design | 17 |
| 6 | Managing vendors | 8 |
| 7 | Uncertain economy | 62 |
Read More About Perkins&Will

Projects
Perkins&Will Takes Home a Best of Year Award for Nemesis Coffee in Vancouver, Canada
2021 Best of Year winner for Hospitality – Coffee Counter. Comprising 10 petals of CNC-cut laminated timber clad in cherry-hued composite-aluminum shingles, this pavilion, an existing structure by Perkins&Will, is round …
Projects
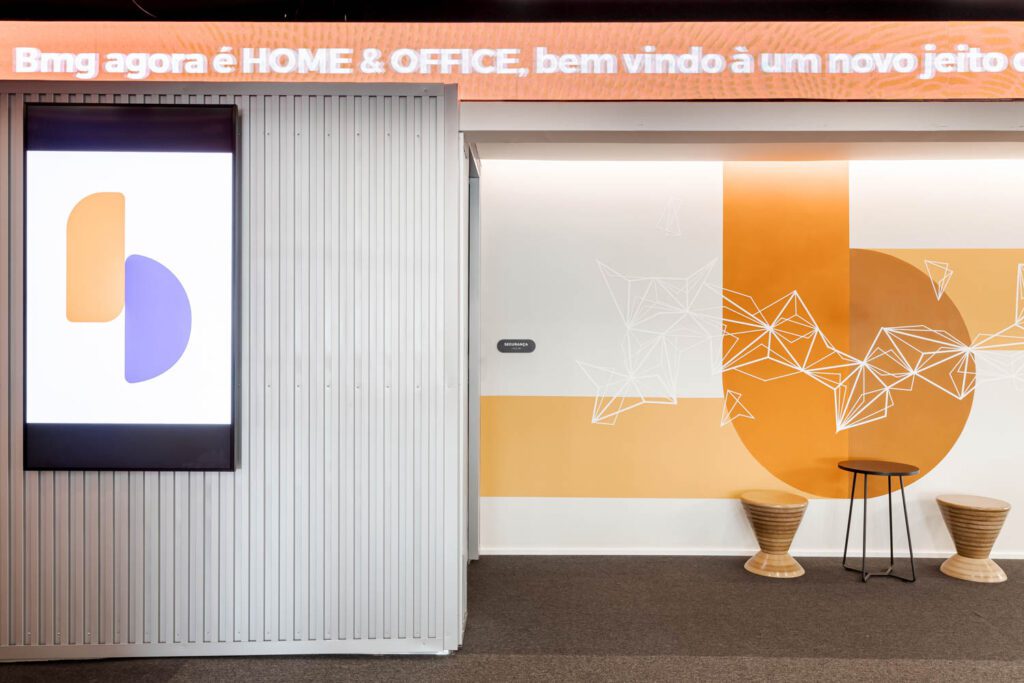
Perkins&Will Brings a Brutalist Gem into the 21st Century for BMG Bank in São Paulo, Brazil
São Paulo has one of the world’s great collections of Brutalist buildings, including a 1984 gem by Marcello Fragelli, now the home to a headquarters for BMG Bank courtesy of transformation by Perkins&Will.
Projects
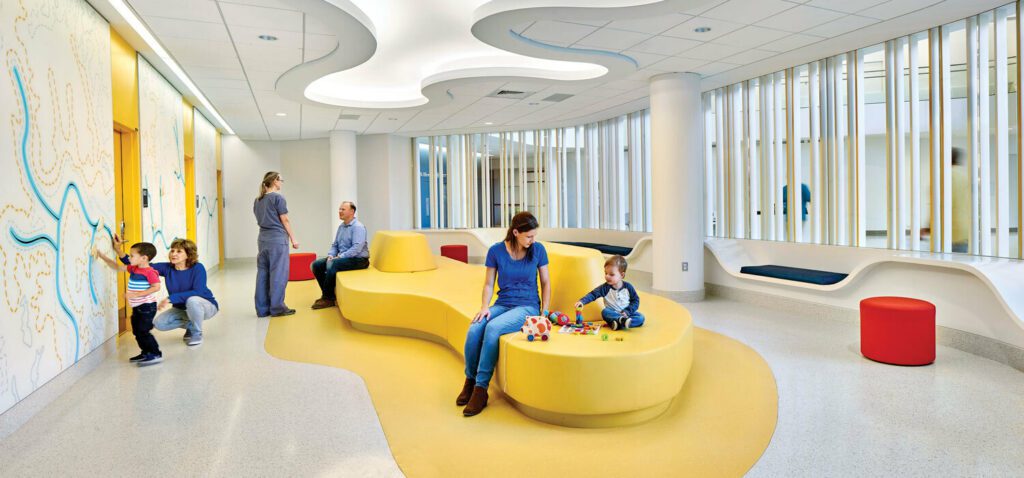
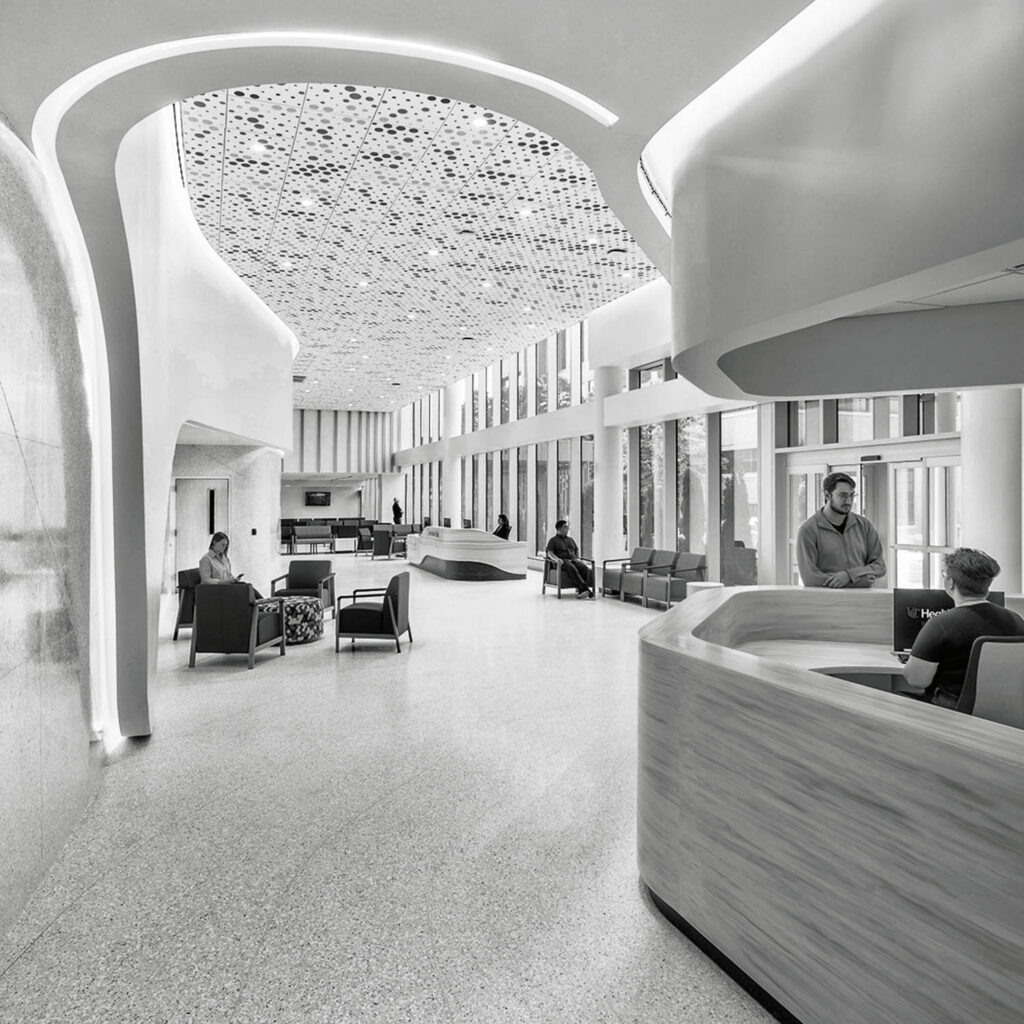
Perkins&Will’s Expansion of UVA Health’s Emergency Department Earns IIDA Accolades
The diagnosis was clear: UVA Health’s emergency department was seeing 60,000 patients a year, a figure 50 percent higher than its intended capacity. Tasked with devising a solution was longtime collaborator Perkins&Wil…
Client Dynamics
| wdt_ID | Client Dynamics | Percentage |
|---|---|---|
| 1 | Competing business entities entering the market (i.e., Co-working, CRE services, etc.) | 21.80 |
| 2 | Client's willingness to pay what it's worth | 3.70 |
| 3 | Finding new clients | 28.70 |
| 4 | Retaining current clients | 9.20 |
| 5 | Getting clients to understand design value | 50.60 |
| 6 | Client's willingness to take design risks | 32.20 |
| 7 | Managing client expectations | 39.10 |
Read More About HOK

Projects
HOK Celebrates the Senses for Shiseido Americas HQ
HOK encourages collaboration at the expansive New York headquarters of personal-care and cosmetics company Shiseido Americas.

Projects
HOK’s Facelift of Ronald and Maxine Linde Hall of Mathematics and Physics is Far from Formulaic
At the California Institute of Technology, HOK’s renovation of the Ronald and Maxine Linde Hall of Mathematics and Physics is more than the sum of its parts.

Projects
Advertising Giant WPP Looks to HOK to Gather Its New York Offices Under One Roof
WPP, the London-based international advertising and public relations behemoth, gathers the New York offices of several subsidiaries into a single location.
Practice Issues
| wdt_ID | Practice Issues | Percentage |
|---|---|---|
| 1 | Recruiting qualified staff | 88.50 |
| 2 | Diversity | 55.20 |
| 3 | Retaining staff | 49.40 |
| 4 | Training staff | 31.00 |
| 5 | Creating new business/Diversifying into new services/segments | 29.90 |
| 6 | Marketing firm's capabilities | 12.60 |
| 7 | Keeping track of profits and expenses | 4.60 |
| 8 | Offering staff appropriate pay scale and benefits | 16.10 |
Read More About Yabu Pushelberg

Projects
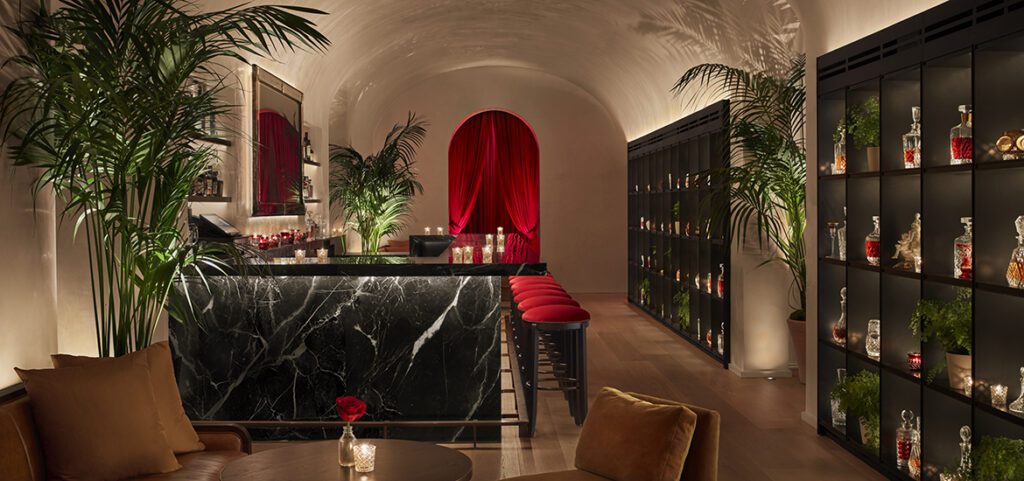
George Yabu and Glenn Pushelberg Design a Dramatic Hotel in Leicester Square
2021 Best of Year winner for Boutique Hotel. Plays staged in the West End have been entertaining theatergoers for over 350 years. As the scene rebounds from pandemic closures, visitors can enjoy that spectacle while stay…

Projects
George Yabu and Glenn Pushelberg Earn a Best of Year Award for This Chic Parisian Store
2021 Best of Year winner for Large Retail. A complex of fin de siècle, art nouveau, and art deco buildings, the last completed in 1928, La Samaritaine, a once-fabled department store in the first arrondissement, has reo…
Projects
The Terrace Brings Rooftop Style to Times Square
The Terrace, designed by Yabu Pushelberg and Ian Schrager, doubles as a garden in the sky that holds thousands of plants, trees, and ivy.
Top 10 Office
| wdt_ID | Firm | Office Fees |
|---|---|---|
| 1 | Gensler | 340,224,083 |
| 2 | Jacobs Engineering Group | 101,571,963 |
| 3 | Perkins&Will | 95,880,000 |
| 4 | M Moser Associates | 67,853,000 |
| 5 | IA Interior Architects | 66,576,720 |
| 6 | AECOM | 57,105,100 |
| 7 | DLR Group | 44,337,000 |
| 8 | STUDIOS Architecture | 38,197,206 |
| 9 | NBBJ | 36,580,000 |
| 10 | HOK | 35,000,000 |
Top 10 Hospitality
| wdt_ID | Firm | Hospitality Fees |
|---|---|---|
| 1 | Cheng Chung Design (HK) Ltd. | 109,608,234 |
| 2 | HBA International | 103,512,000 |
| 3 | Gold Mantis Construction Decoration Co. | 56,940,000 |
| 4 | Rockwell Group | 22,927,898 |
| 5 | Perkins Eastman | 20,283,400 |
| 6 | Gensler | 19,919,142 |
| 7 | Populous | 19,815,523 |
| 8 | AvroKO | 13,728,837 |
| 9 | Gettys Group | 13,275,000 |
| 10 | DLR Group | 12,091,900 |
Top 10 Retail
| wdt_ID | Firm | Retail Fees |
|---|---|---|
| 1 | Gold Mantis Construction Decoration Co. | 50,700,000 |
| 2 | Gensler | 35,491,641 |
| 3 | NELSON Worldwide | 25,936,961 |
| 4 | CallisonRTKL | 20,915,060 |
| 5 | Sargenti | 19,000,000 |
| 6 | RSP Architects | 16,476,000 |
| 7 | Little Diversified Architectural Consulting | 10,031,331 |
| 8 | Ware Malcomb | 6,526,897 |
| 9 | TPG Architecture | 5,719,000 |
| 10 | ASD|SKY | 5,700,000 |
Top 10 Government
| wdt_ID | Firm | Government Fees |
|---|---|---|
| 1 | Jacobs Engineering Group | 151,724,869 |
| 2 | AECOM | 46,052,500 |
| 3 | Gensler | 29,140,091 |
| 4 | HOK | 24,000,000 |
| 5 | Skidmore, Owings & Merrill | 14,190,000 |
| 6 | EYP | 13,333,952 |
| 7 | Page | 12,585,600 |
| 8 | KCCT | 12,450,000 |
| 9 | Leo A Daly | 12,250,147 |
| 10 | Stantec | 9,418,555 |
Top 10 Healthcare
| wdt_ID | Firm | Healthcare Fees |
|---|---|---|
| 1 | HDR | 60,873,600 |
| 2 | CannonDesign | 60,000,000 |
| 3 | Perkins&Will | 56,400,000 |
| 4 | Gensler | 50,926,397 |
| 5 | Perkins Eastman | 41,580,970 |
| 6 | AECOM | 40,526,200 |
| 7 | HKS | 40,249,723 |
| 8 | SmithGroup | 34,237,879 |
| 9 | HOK | 33,290,000 |
| 10 | HGA | 28,056,074 |
Top 10 Education
| wdt_ID | Firm | Education Fees |
|---|---|---|
| 1 | CannonDesign | 30,000,000 |
| 2 | HOK | 24,000,000 |
| 3 | SmithGroup | 19,564,502 |
| 4 | Stantec | 17,783,435 |
| 5 | Gensler | 15,400,000 |
| 6 | DLR Group | 15,045,950 |
| 7 | Perkins Eastman | 13,184,210 |
| 8 | Corgan | 13,000,000 |
| 9 | AECOM | 12,894,700 |
| 10 | Flad Architects | 10,077,000 |
Top 10 Residential
| wdt_ID | Firm | Residential Fees |
|---|---|---|
| 1 | Matrix Design Co. | 70,650,000 |
| 2 | Gold Mantis Construction Decoration Co. | 61,620,000 |
| 3 | Steve Leung Design Group | 52,101,000 |
| 4 | Marc-Michaels Interior Design | 27,250,000 |
| 5 | CDC Designs | 26,450,000 |
| 6 | TRIO | 17,500,000 |
| 7 | Stantec | 16,707,708 |
| 8 | NicoleHollis | 14,670,006 |
| 9 | Ryan Young Interiors | 9,041,891 |
| 10 | Rockwell Group | 8,771,376 |
Top 10 Cultural
| wdt_ID | Firm | Cultural Fees |
|---|---|---|
| 1 | Gensler | 24,117,964 |
| 2 | HOK | 20,000,000 |
| 3 | Stantec | 11,929,269 |
| 4 | AECOM | 9,210,500 |
| 5 | DLR Group | 4,030,650 |
| 6 | HGA | 3,754,109 |
| 7 | STUDIOS Architecture | 3,583,408 |
| 8 | OTJ Architects | 3,509,156 |
| 9 | Populous | 2,914,047 |
| 10 | Rockwell Group | 2,814,826 |
Top 10 Transportation
| wdt_ID | Firm | Transportation Fees |
|---|---|---|
| 1 | Gensler | 26,225,117 |
| 2 | PGAL | 25,770,950 |
| 3 | ZGF | 16,520,000 |
| 4 | Corgan | 16,000,000 |
| 5 | AECOM | 14,736,800 |
| 6 | HOK | 12,000,000 |
| 7 | YiTian Design Group | 11,060,156 |
| 8 | Jacobs Engineering Group | 9,493,257 |
| 9 | Stantec | 7,658,880 |
| 10 | IA Interior Architects | 7,032,480 |
Methodology
The first installment of the two-part annual business survey of Interior Design Giants comprises the 100 largest firms ranked by interior design fees for the 12-month period ending December 31, 2021. The 100 Rising Giants ranking will be published in August. Interior design fees include those attributed to:
All types of interiors work, including commercial and residential.
All aspects of a firm’s interior design practice, from strategic planning and programming to design and project management.
Fees paid to a firm for work performed by employees and independent contractors who are “full-time staff equivalent.”
Interior design fees do not include revenues paid to a firm and remitted to subcontractors who are not considered full- time staff equivalent. For example, certain firms attract work that is subcontracted to a local firm. The originating firm may collect all the fees and retain a management or generation fee, paying the remainder to the performing firm. The amounts paid to the latter are not included in fees of the collecting firm when determining its ranking. Ties are broken by dollar value of products installed, square footage of projects installed, and staff size respectively. Where applicable, all percentages are based on responding Giants, not their total number.
All research conducted by ThinkLab, the research division of the Sandow Design Group.
Recent Stories
Research
Introducing Interior Design’s 2026 Rising Giants
The story of 2025 for the Rising Giants is pretty much the same as for the top most 100 firms: stability. Plus, Rising Giants saw positive strides in fee income.
Research
A Look At Interior Design’s 2026 Top 100 Giants
Interior Design’s 2026 Top 100 Giants tells a story of resilience as the industry’s most prominent firms continue to adapt and thrive.
Research
A Spotlight on Interior Design’s 2025 Healthcare Giants
Interior Design’s Healthcare Giants surged ahead with steady momentum in 2025, marking a year of impressive growth and reinforcing the sector’s momentum.